Want to know an expert statistical opinion about which FIDE-strength players you should avoid facing? The Elo system is supposed to be fair toward players of all strengths, but Jeff Sonas sees major problems with the current state of the FIDE Elo rating pool, and it’s getting worse each year. It will take multiple articles to walk you through the analysis, but here is chapter one of the story.
Analysis of the problem by Jeff Sonas
Part 1
In theory, the FIDE Elo rating system ought to function equally well no matter what your opponent’s Elo rating is. You wouldn’t need to worry much about whether you’re facing opponents with higher, lower, or similar Elo ratings to your own, because your expected score would be realistic and fair in all those cases. However, according to chess statistician Jeff Sonas it looks like the FIDE Elo system is not actually working well in this regard. In fact Jeff thinks the problem is getting worse and worse each year.
Let’s start with a concrete example. Imagine a 28-year-old English player named Michael, with a standard FIDE Elo rating of 1950 and a K-factor of 20. He suspects it is possible to “game the system” a bit, maximizing his rating by being careful about which tournaments he plays in. He will choose one of these three events to play in:
- Midland Championship Major (average player rating: 1550)
- Northumbria Challengers (average player rating: 1750)
- Northumbria Masters (average player rating: 2150)
For this example, we will make the simplifying assumption that Michael’s opponents in the Midland Championship Major would have ratings ranging from 1400 to 1699 (with an average of 1550), and the opponents in the Northumbria Challengers would range from 1600 to 1899 (with an average of 1750), and the opponents in the Northumbria Masters would range from 2000 to 2299 (with an average of 2150). Which event should he choose?
Many people think it’s best for your rating if you just face (and dominate) relatively weak opponents in an event where you can build up a big plus-score, and so your initial answer might be that it’s best (for Michael’s rating) for him to enter the weakest event: the Midland Championship Major, with players averaging 400 points weaker than Michael. But it’s not that simple.
Certainly it is true that Michael’s best chances for a high percentage score would be in the weakest event. On the other hand, with Michael having such a large rating advantage, the Elo Expectancy Table would also predict Michael to score really well against those weak opponents, making it hard for him to exceed expectation and actually gain rating points. From the perspective of his desired rating gain/loss, he is really competing against the expected scores calculated from that table. He could win the event and lose rating points at the same time!
Another plausible answer is that it doesn’t matter which event Michael plays in. In the Midland Championship Major, his rating says he should score 89% and so perhaps we just trust that on average he would score 89% and break even from a rating standpoint. Whereas in the Northumbria Challengers, his rating says he would score 74%, and in the Northumbria Masters, his rating says he would score 26%, and we could make the same argument in all these events, that he ought to perform in accordance with the Elo expectation. A decade or two ago, this might have been a reasonable argument. However, it doesn’t work in today’s chess world and today’s FIDE rating pool.
I have access to a very large dataset of chess data, including all of the game results that FIDE has used for rating calculation, going back more than a decade, and so I am going to bring some real-world data into this argument. We can look at the last few years’ worth of games, in each case checking what the Elo expected score was and what the actual result was, and then compare how well they have matched up (on average).
To keep a manageable size to our analysis, we will create a few groups of players based on rounding down their ratings to the nearest 100. Or you can think of it like all players in the same group have the same first two digits in their rating. So all rated players would be in one of 19 groups: either those rated 1000-1099, those rated 1100-1199, …;, 2700-2799, or 2800-2899. And players move from one group to another over time, as their ratings change. To save space, we will call these the 10xx, 11xx, …;, 27xx, and 28xx rating groups.
For each rating group, we will see how they performed against each other rating group. We will only consider standard (classical) chess for now, and to make sure we are capturing the current state of things, we will only consider games played in 2017, 2018, or 2019.
Michael is rated 1950, and our simplified Midland Championship Major has players ranging from 1400 to 1699. Let’s start by checking our database and seeing how 19xx players (such as Michael) have done against 14xx opponents.
Across 2017-2019, I can find 22,150 games where a player rated 1900-1999 faced an opponent rated 1400-1499. In such a matchup, the Elo table always gives the higher-rated player an expected score of 92% (the “400-point rule” ensures this), but in the actual game results, the higher-rated player has only scored 86.6%. From the perspective of the 19xx player, here are the numbers:
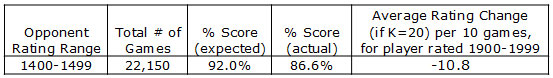
So if Michael played a 10-game event against nothing but 14xx opponents, he would probably average about 8.66 points out of 10. This would actually be pretty bad for his rating, because the Elo system predicts 9.2 points out of 10 for him, and thus overall we would expect Michael (having a K-factor of 20) to lose about 10.8 rating points in such an event. You can see this in the rightmost column in the above table.
And then we can do a similar calculation for the games where players of Michael’s strength (namely, in the 19xx group) faced opponents in the 15xx or 16xx groups. This completes the 300-point rating range in our hypothetical “Midland Championship Major”. Let’s add in those two groups into our table, and the bottom row will show the overall average across all three categories of opponent in this tournament.
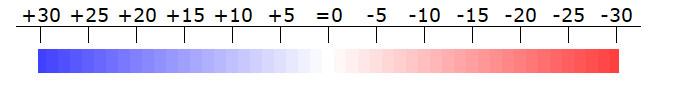
We will also color-code the final column (the overall expected rating gain/loss for Michael in a ten-game event) with a red/blue gradient. Under this coloring scheme, larger negative numbers are a darker red, larger positive numbers are a darker blue, and the red/blue colors get lighter and lighter as they approach zero (which is white). So blue is good for Michael’s rating, red is bad for Michael’s rating, and the darker colors are the more extreme rating changes.
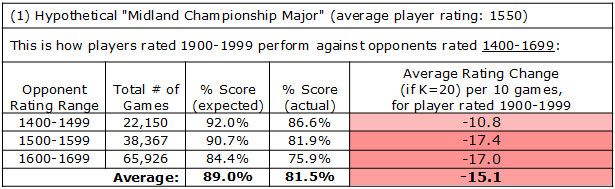
So we can see that games against the 15XX or 16XX groups are even worse for Michael’s rating (the negative numbers are larger magnitude, and the red color is darker) and overall across the three ranges, the Elo system would predict an 89.0% score for him at this tournament, whereas empirical data suggests he would score 81.5% instead. So across ten games at this tournament, Michael can expect to lose 15 rating points, even if he performs at a typical level for a player with his rating. Thus it seems that entering a tournament like this against significantly weaker players is not a good tactical choice for Michael, if he wants to maintain his rating.
What about the second option? The hypothetical “Northumbria Challengers” is a little stronger event where the opponents would be (on average) 200 points weaker than Michael. Is this a good opportunity for him to build up his rating against weaker foes? Well, when we check the numbers again, it’s not quite as bad as the first tournament, but this event turns out to be another one where we expect Michael to lose rating points, just based on how players in his rating group tend to do against such opponents:
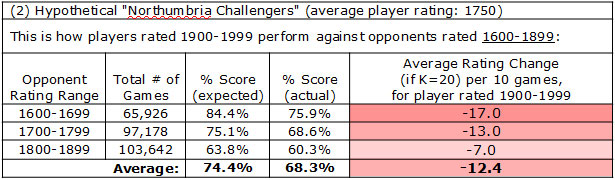
Across ten games against this level of opposition, Michael would probably score about 6.5 or 7.0 points (the 68.3% in the bottom row tells us this), but the Elo system yields an expected score of 74.4% for him, and so overall he would expect to lose about 12 rating points in such a ten-game event, if he performs like a typical 19xx player. Another red tournament to avoid!
Fortunately for Michael, there is one more option. In the third tournament, the hypothetical “Northumbria Masters”, Michael would finally be outrated (by an average of 200 points). At last there is some good news for Michael: he can expect to outperform his Elo prediction against these opponents! Here is what the numbers look like for 19xx players against the three groups (20xx, 21xx, and 22xx):
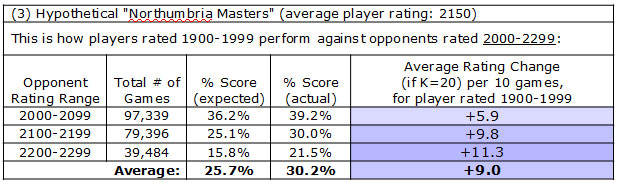
In a ten-game event against these opponents, his Elo rating would predict a 25.7% score, but empirical evidence suggests Michael would really average more like 30%, and thus he can expect to gain about 9 rating points if he performs in typical fashion for his rating group. The rightmost column is colored blue because Michael can expect to gain rating points from his games against such opponents. And in fact, the 22xx opponents are preferable to the 21xx or 20xx opponents, as you can see from the blue being darker and the +11.3 being a bigger number than in the other two rows. So even better than the “Northumbria Masters” would be if Michael could face exclusively the 22xx group.
What has Michael learned from this exercise? It’s better for his rating if he plays somewhat stronger opponents rather than somewhat weaker opponents. And amazingly, this is not just true for someone of Michael’s approximate strength, but rather it’s true across the entire rating list, although the effect is not as pronounced at the very top. We will look at this in greater detail in upcoming articles.
If you are comfortable by now with the red/blue coloring scheme, and with the idea that we are always looking at what the expected rating change will be for someone with K=20 across a ten-game event, we can take the logical next step, which is to see what the pattern is for all possible opponents of a 19xx player like Michael. We will get rid of the middle columns from our table, and instead we will just show the leftmost (Opponent Rating Range) and rightmost (Average Rating Change) columns. Again, the rating change is from the perspective of the 1900-1999 player with a K-factor of 20.
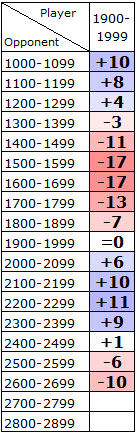
This reveals a characteristic pattern to the empirical data. Note that we are only showing data for cells where we have at least 500 games of historical data, so that’s why the cells are blank against the 27xx and 28xx groups; there are not enough games played by 19xx players against such opponents to get useful data. Also note that when a 19xx player faces other 19xx players, the average expected score is 50% and the average actual score is 50% (due to the symmetry of both people counting as both the “player” and the “opponent”), and so the cell is a solid white (zero expected rating change) on the “1900-1999 row” when the group faces itself.
From the darkest-colored cells, and/or the largest magnitude numbers, we can see that the opponents that are most advantageous to Michael’s 19xx group are those in the 21xx, 22xx, and 23xx group. Against opponents that are 200-400 points stronger, Michael can expect to outscore his expectation by about 5 percentage points, meaning if he is K=20 then he will gain about 10 rating points for every ten games played. However, if he faces opponents that are 200-400 points weaker than him (the 15xx, 16xx, and 17xx) then he can expect to lose about 15 or 16 rating points for every ten games played.
This effect peaks at a rating difference around 200-400 Elo points. And even though the darkest colors are at +/- 200-400 points, for even larger rating differences we see that something else takes over. Namely, the “400-point rule” that I mentioned earlier. This rule was originally instituted as a “350-point rule” to incentivize grandmasters to play in open tournaments. It was adjusted to become a “400-point rule” about a decade ago, and it ensures that the expected score from a one-sided game can never be higher than 92% or lower than 8%. As it turns out, if Michael gets to face weak enough players, he can score far better than 92%. So that is why we see some dark blue at the very top, where empirical data tells us that the 19xx group tends to score 96% against 11xx opponents and 97% against 10xx opponents, and so if Michael can arrange to face really weak opposition like that, he can expect to dominate and have it do good things to his rating.
And conversely, the “400-point rule” works against Michael if he faces really strong opposition himself. When the 19xx group faces opponents in the 26xx group, they have only managed to score about 3% on average, which means Michael would lose significant rating points if he performed as expected against 26xx opposition. We can see this from the darker red color at the bottom of the grid, against 2600-2699 opposition.
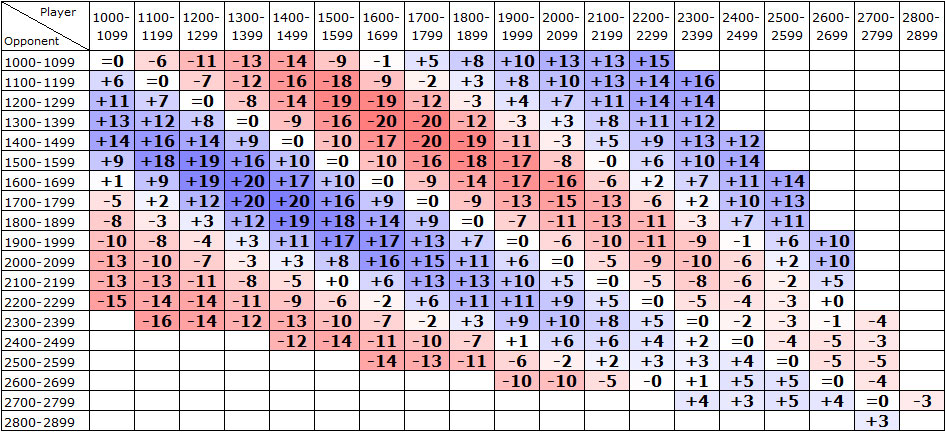
Enough about Michael and his hypothetical three tournaments he was trying to choose from. If you have a rating yourself, and you are still with me in reading this article, then first of all: thanks for persevering! And second of all, let’s expand that last graphic to the left and the right to include all 19 of the rating groups, not just Michael’s 19xx group. You may well be wondering yourself what level of opponents you should seek out, or avoid, in order to maximize the likely effect on your own rating. If so, just find the column that corresponds to your rating group, and then look for the darkest blue cells in your column:
Also remember that these numbers refer to the expected rating change from playing 10 games at K=20. If you have a K-factor of 40, you should double these numbers, and if you have a K-factor of 10, you should divide them by 2.
If the Elo expectancy table were systematically fair and realistic, then this grid would be colored solid white, or only very light red or light blue. Unfortunately there are indeed some very dark regions, especially where players rated 1300-1499 are facing opponents rated 1600-1799. A few things you might notice upon reflection:
- It is true up-and-down the rating list, that players with a 200-400 point Elo advantage in a game will have real trouble in just “treading water” and maintaining their rating, because the Elo table consistently overstates their chances in such games.
- This effect is strongest among relatively weak players (1400-1800 Elo rating) and not as present among stronger players
- The “400-point rule” is too tight of a constraint; instead of the expected score being capped at 92%/8% for rating differences exceeding 400 points, it would function better statistically as a “600-point rule” or “700-point rule”, capping the expected score at 98%/2% or even 99%/1%. This would admittedly provide lesser incentive for master-level players to compete in open events, but it is worth considering.
And I think the most important insight of all is this: the FIDE Elo rating pool is too stretched out. This has the result of exaggerating the true difference in strength between any two players, and so the expected score is calculated to be further from 50% than it really should be. And this is a very difficult problem to solve. It cannot be solved by simply adjusting the Elo Expectancy Table; if we did that, then the ratings would respond accordingly and we would be in the same boat again. It is much trickier to solve than that.
This is far from the end of the story, but perhaps it is a good place to end the first chapter. Hopefully we have set the stage for the next analysis. In the next article I will dig into this topic more deeply, including my assertion that things are getting worse and worse each year.
Source: chessbase.com